- The College Crest by Lets Unbound
- Posts
- Demystifying the Common Data Set: Your Secret Weapon for College Research
Demystifying the Common Data Set: Your Secret Weapon for College Research
A Student's Guide to Understanding and Using This Powerful College Planning Tool! [Don't miss the free Bonus at the end]
The College Crest by Lets Unbound & Nishant Chawla
September 21, 2025

If you’ve started exploring colleges, you’ve probably noticed how confusing the search can feel. Every school seems to publish different statistics, and it’s hard to tell which numbers actually matter.
That’s where the Common Data Set (CDS) comes in. Think of it as a behind-the-scenes report card that colleges share every year. Unlike glossy brochures or marketing emails, the CDS is designed for transparency. It’s a gold mine of reliable information—if you know how to read it.
This newsletter breaks the CDS down: what it is, why it exists, and how you can use it to make smarter college decisions.

What Is the Common Data Set?
The Common Data Set, often referred to as CDS, is a standardized report that colleges and universities across the United States complete annually. It offers clear, consistent information on key aspects of an institution, helping prospective students, parents, and researchers compare and evaluate schools. The CDS is organized into multiple sections covering areas such as admissions, enrollment, financial aid, and academic programs, giving a comprehensive view of each college or university.
All sections include (A to J):
Section A – General Information: Basic facts like location, academic calendar, and degrees offered.
Section B – Enrollment & Persistence: Total student counts, retention rates, and graduation rates.
Section C – First-Year Admission: Application numbers, acceptance rates, test-score ranges, and admission factors.
Section D – Transfer Admission: Policies, requirements, and statistics for transfer applicants.
Section E – Academic Offerings & Policies: Majors, special programs, and academic requirements.
Section F – Student Life: Housing, campus activities, and demographic breakdowns.
Section G – Annual Expenses: Tuition, fees, and estimated student living costs.
Section H – Financial Aid: Types of aid, average awards, and percentage of students receiving aid.
Section I – Instructional Faculty & Class Size: Faculty numbers, student-faculty ratios, and class-size distribution.
Section J – Degrees Conferred: Degrees awarded by field and academic year.
Because every participating college uses the same template, you can easily compare data across schools without digging through different websites or marketing materials.
Bonus Tip: Don’t just compare numbers. Focus on which colleges fit your intended career path.
For example, if you have a stellar SAT score of 1580 but only average grades, look for schools that offer your desired major and place more weight on test scores than on GPA.
What’s the most confusing part of college research for you? |
Why Does the Common Data Set Exist?
The Common Data Set Initiative was launched in the late 1990s.
It is a collaborative effort between data providers in higher education and publishers.
The official CDS site states the primary publishers involved were:
College Board
Peterson’s
U.S. News & World Report
These groups collaborated with colleges and universities to standardize the collection and reporting of institutional data.
Previously, every ranking system or website had to request data from colleges in various formats. The CDS solved that by introducing a common standard—hence the name.
So why do colleges spend hours filling this out?
Transparency: Families want accurate information. The CDS makes schools accountable by sharing details like admission rates and financial aid generosity.
Rankings: Publications like U.S. News use CDS data to build their rankings (which, love them or hate them, still influence students and parents).
Comparability: Because the format is standardized, you can compare different colleges without worrying that one is reporting in a completely different style.
Research: For counselors, journalists, and education researchers, CDS data is an invaluable way to analyze trends.
In short, colleges don’t publish CDS out of kindness. They do it because rankings, reputations, and families all demand accurate, accessible information.

How to Use the Common Data Set
Here’s the good part—how you, as a student, can use the CDS to your advantage.
1. Check Acceptance Rates and Admit Trends
Instead of trusting rumors, look at the CDS to see:
How many students applied.
How many were admitted.
How many actually enrolled (this is called “yield”).
Example: If a school admits 10,000 students but only 2,000 enroll, you know they’ll use waitlists aggressively. That’s a clue on how “competitive” the process might feel.

2. Understand What Really Matters in Admissions
Section C7 of the CDS lists academic and non-academic factors and whether each is Very Important, Important, Considered, or Not Considered.

For example:
A liberal arts college may list essay and recommendations as “Very Important.”
A large state university might mark GPA and test scores as the top priorities.
This section is like looking at the college’s “grading rubric” for applications. Use it to decide where to invest your time and energy.
3. Decode Test-Optional Policies
Almost every college says “test optional” these days—but the CDS tells you how many admitted students actually submitted scores.
If 70% of admitted students at a “test optional” school submitted SAT/ACT scores, you’ll know test scores still play a big role. If only 20% submitted, then maybe scores truly aren’t critical there.

4. Plan High School Coursework Smartly
The CDS lists required and recommended high school courses (e.g., 4 years of English, 3 years of math, 2 years of foreign language).

If your dream school requires 3 years of a foreign language, you don’t want to find out in senior year that you only took 2.
5. Explore Financial Aid Generosity
Section H is one of the most practical sections for families. It shows:

Average need-based aid packages.
Percent of students who received aid.
Average merit scholarships (for students who don’t qualify for need-based aid).
Percent of need met (does the college cover 50% of your need…or 100%?).
For example, if a school covers 97% of demonstrated need and gives large merit scholarships, it may end up being cheaper than a public university that looks “affordable” at first glance.
Sometimes, data reveals surprising advantages. Example:
If a college has far more women than men applying, male applicants might have a slightly higher admit rate (and vice versa at tech-heavy schools).
If demonstrated interest is “Important,” attending a virtual info session could give you an edge.
If waitlist numbers are huge but very few are admitted from it, you’ll know not to count on that path.
By reading between the lines, the CDS helps you play smarter, not harder.
7. Spot Long-Term Trends
Most colleges archive several years of CDS reports. Comparing them can show:
Whether acceptance rates are dropping or increasing.
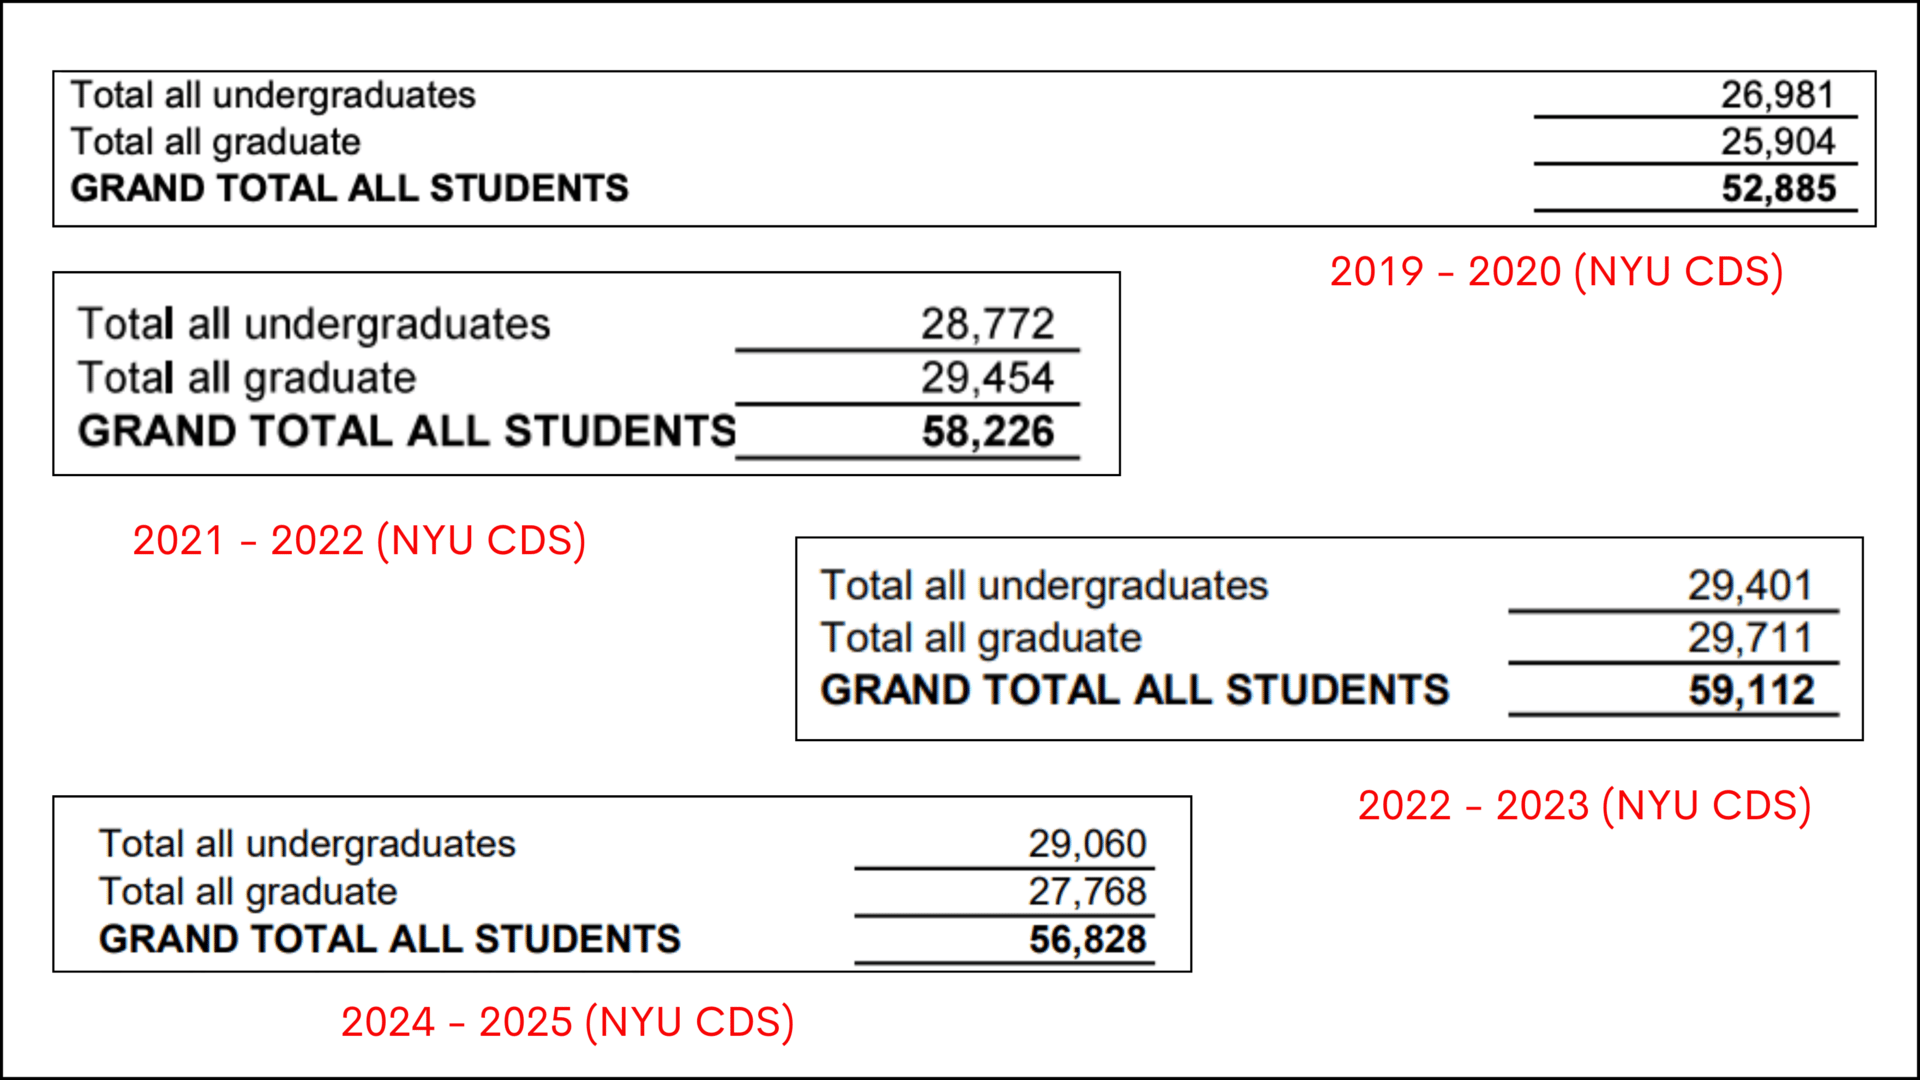
Total Number of Students Accepted at NYU Over Different Years
If test scores of admitted students are rising.
Whether financial aid awards are becoming more generous or stingier.
This can help you predict where things might be heading by the time you apply.
Final Words
The Common Data Set is not flashy. It’s not advertised in brochures. You probably won’t hear about it from social media influencers. But for students who want real insight into colleges, it’s one of the most powerful tools available.
Here’s how to start using it:
Google “[College Name] Common Data Set.
Focus on Sections C (Admissions) and H (Financial Aid).
Compare across schools you’re considering.
Use the data to guide your application strategy—what to emphasize, whether to send test scores, how to budget for costs.
Remember: knowledge is power. The CDS won’t get you admitted on its own, but it will help you understand what colleges value and how to position yourself. Instead of feeling lost in the admissions maze, you’ll have a clear map.
So the next time you’re curious about a college, skip the gossip and rankings. Go straight to the source—the Common Data Set.
Reminder: Don’t fall for clickbait headlines or biased advice on social media. Rely on objective, verifiable sources—like the Common Data Set—for decisions that shape your college future.

Do you need a FREE expert review of your Common App or UCAS Application? |
At a Glance ⚡️
1. What Is the Common Data Set (CDS)?
📍 A standardized annual report that U.S. colleges complete to share accurate, apples-to-apples data.
📍 Covers everything from admissions numbers and test-score ranges to financial aid, class sizes, and student life.
📍 Usually posted as a PDF on a school’s Institutional Research or Institutional Effectiveness webpage.
2. Why It Exists
📍 Transparency: Gives families reliable, fact-based insight beyond brochures and marketing.
📍 Consistency: Every participating college uses the same template, so comparisons are easy.
📍 Rankings & Research: Created in the late 1990s with U.S. News, the College Board, and Peterson’s to supply trusted data for rankings, counselors, and researchers.
3. Key Sections to Know
📍 General Info (Section A): Location, academic calendar, and degrees offered.
📍 Enrollment & Persistence (Section B): Total students, retention, and graduation rates.
📍 Admissions (Section C): Applicants, acceptance rates, SAT/ACT middle 50%, waitlist details, and what factors (GPA, essays, activities) matter most.
📍 Student Life (Section F): Housing, campus diversity, clubs, and Greek life.
📍 Financial Aid (Section H): Average need-based aid, merit awards, and % of need met.
📍 Faculty & Class Size (Section I): Student–faculty ratios and small-class percentages.
4. How to Use It
📍 Find It: Google “[College Name] Common Data Set” or look on the school’s Institutional Research page.
📍 Compare Schools: Drop key numbers into a spreadsheet to track selectivity, aid generosity, or class size.
📍 Check Admissions Priorities: Section C7 reveals which factors each college rates as Very Important, Important, or Not Considered.
📍 Gauge Test-Optional Reality: See what % of admitted students actually submitted SAT/ACT scores.
📍 Plan Coursework & Budget: Confirm high-school course requirements and review average aid packages.
📍 Spot Trends: Download past years’ CDS reports to see how acceptance rates, scores, or aid are shifting.
5. Bottom Line
📍 The CDS is a no-hype, data-driven guide to understanding colleges.
📍 Use it to target the right schools, decide on test submissions, plan finances, and craft a smart application strategy.

—--------------------------------------
Amol & Nishant,
The College Crest - Powered by Lets Unbound,
We have worked with thousands of students over the past 7 years. This newsletter captures the essence of our insights to simplify the college readiness journey.